The International Red Cross and Red Crescent Movement: the full financial picture
The International Red Cross and Red Crescent Movement, made up of the International Federation of the Red Cross and Red Crescent Societies (IFRC), the International Committee of the Red Cross (ICRC) and 186 National Societies, is the world’s largest humanitarian network, with a presence and activities in almost every country.
The Movement has a complex resource architecture that includes bilateral (direct funding between two elements of the Movement such as between National Societies) and multilateral pathways (when funds are channelled via a third party such as through IFRC) with resources mobilised from various sources – governments, multilateral organisations, private contributions and commercial enterprises amongst others. Currently, the volumes and trends of resources within the whole Movement are not being captured as data on funding flows within the different pathways are not compiled into a single analysis.
Data on multilateral funds, produced by IFRC, as well as information from ICRC, has fed into previous Global Humanitarian Assistance (GHA) reports, yet this gives only a partial picture. For example, in 2009 IFRC estimated that multilateral funding was only 30% of the total income to the Movement. Although some National Societies detail financial statements in their annual reports, using these statements for analysis is extremely challenging as the data is not comparable. IFRC is establishing a Federation-wide reporting system for National Societies and the Secretariat that includes total income and total expenditure as indicators. In the long term, the IFRC is hoping to capture greater detail such as sources of income and patterns of expenditure.
The Global Humanitarian Assistance programme wants to add to the understanding of financing volumes and trends Movement-wide. We, therefore, contacted 12 Red Cross and Red Crescent National Societies and asked them to complete a template detailing their income and expenditure in 2010 and 2009. Seven National Societies replied – Belgium, Canada, Colombia, Denmark, France, Sweden and the United Kingdom. All seven provided income data for 2009 whereas five provided it for 2010. Four provided expenditure data for 2010 and five provided it for 2009. National Societies vary in their strategies and funding patterns and, therefore, the data portrayed here cannot be extrapolated across other Societies, especially given the small sample size. Despite this, the study does highlight the wider income and expenditure for seven National Societies as well as the complexities around how National Societies perceive their mandate and their expenditure behaviour.
Income
Combined data on the humanitarian income for 2009 and 2010 shows that private donations from individuals to the National Society in their country of residence made up the largest share of income (41%) while income generating activities (contracted and commercial services) made up the second largest share (24%).
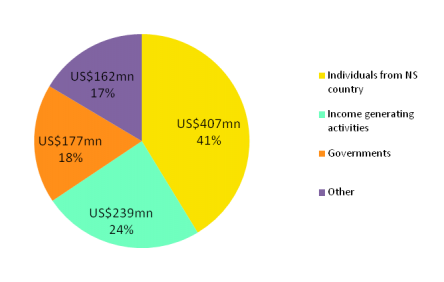
Figure 1. Top three sources of humanitarian income in 2009 and 2010 combined
In comparison, the combined data on total income (development and humanitarian) for 2010 and 2009 shows that income-generation contribute the largest amount (36%), while governments make the second largest (26%) and individuals contributing to their own National Society the third largest (25%).
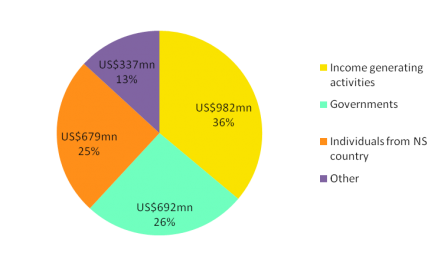
Figure 2. Top three sources of total income in 2009 and 2010 combined
Comparatively, other sources of humanitarian income represent a significantly smaller proportion of the overall funding. The National Societies appear to receive only marginal volumes of money from other delivery agencies, for example from UN agencies or other multilateral organisations such as the World Bank or regional development banks. Funding passed from the UN system on to the seven National Societies only amounted to 2.1% of the total (see table below).
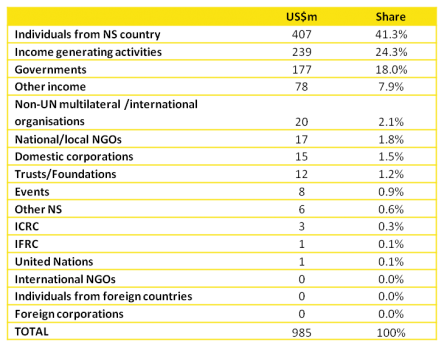
Table 1. Sources of humanitarian income in 2010 and 2009 combined
If we assume that only contributions from individuals, trusts/foundations and corporate giving is classed as private income, then at least 44% of the income to the seven National Societies came from private sources. However, if the money raised through income generating activities, such as the sale of promotional items, first aid training, gaming and lottery and income from investments, is taken into account this share could reach 68%. In comparative terms, our previous research on implementing organisations has shown that the main non-governmental organisations (NGOs) receive on average 58% of their income from private sources.
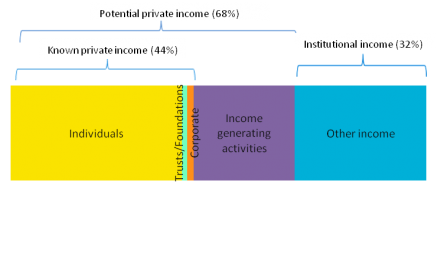
Figure 3: Average private and institutional income for humanitarian aid for seven National Societies in 2009 and 2010 combined
However, the volume of private income, defined in wider terms for the purposes of our research as funding coming from individuals, corporations, trust/foundations and income generating activities varies extensively across National Societies. For example, this only made up 18% of the total income of Belgian Red Cross in 2010 and 2009 combined, whereas for the same period it was 84% of the total income of the British Red Cross. Similarly, income generation provides 2% of the total income to the Danish Red Cross in 2009 whereas it was 72% of the income of the French Red Cross in the same year.
Expenditure
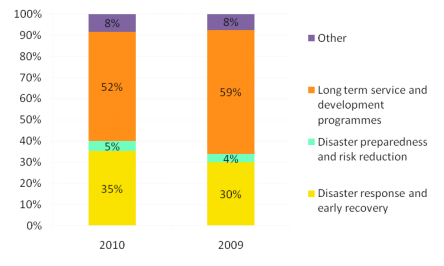
Figure 4: Total expenditure of National Societies, 2009-2010
The majority of funds from our sample data were spent on long term services and development programmes – 52% in 2010 and 59% in 2009 – whereas disaster response and early recovery made up the second largest share, 35% in 2010 and 30% in 2009. Furthermore, the majority of funds were spent domestically, 61% in 2010 and 58% in 2009. The whole of Colombia’s expenditure is spent domestically, which is perhaps not surprising given it is a recipient National Society, but when the Colombia Red Cross is omitted from the sample, the domestic expenditure is still 60% in 2010 and 57% in 2009, which is more surprising given the other National Societies are from high-income countries. Examples from the British Red Cross data show that domestic expenditure included event first aid and first aid training, fire and emergency support services, refugee services and care in the community.
In terms of international expenditure, more funds were spent multilaterally than bilaterally. In 2010, 27% of funds were spent multilaterally and 9% were spent bilaterally, whereas in 2009 17% of funds were spent multilaterally and 14% were spent bilaterally. While these shares are not in line with previous findings from IFRC that over two-thirds of the Movement expenditure is bilateral, our limited sample size does not necessarily mean that this difference in the results is significant.
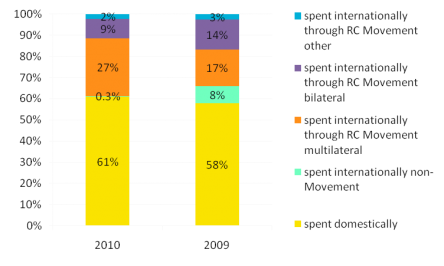
Figure 5: Channel of expenditure of National Societies, 2009-2010
The table below illustrates the differences between how National Societies perceive their mandate. For example, the British Red Cross states that all their activities are humanitarian even though it spends more on long term services and development programmes than disaster response and early recovery, and on disaster preparedness and risk reduction combined, and despite having a greater domestic (66%) expenditure than international (34%). By contrast the Danish Red Cross reports that 93% of its income is development funding while 78% of its expenditure is on long term services and programmes and 59% is spent domestically. The Colombia Red Cross spends all its funds domestically, 77% of which is on disaster response and early recovery.
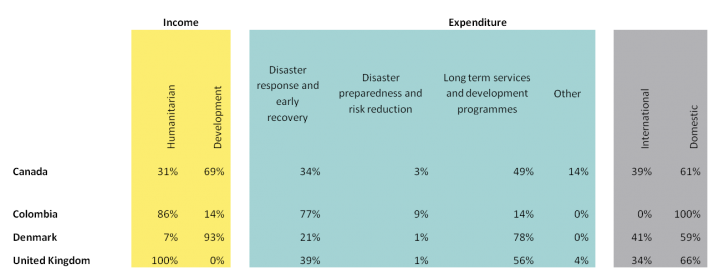
Table 2: Trends across four National Societies 2010 and 2009
This analysis, however insufficiently representative to be extrapolated across all National Societies, provides an interesting insight into their financial structure. In terms of humanitarian income, it portrays an overall prevalence of private funding over governmental and other sources of income. More specifically, income generating activities appear to be a considerable source of financing for National Societies and an income strategy that clearly differentiates them from most other NGOs and civil society organisations. In terms of expenditure, the study shows that domestic activities outweigh the international aid programmes for all National Societies participating in the research. This finding, while not unexpected for the Colombian Red Cross, may be regarded with surprise for the other National Societies that are based in high-income countries.
Although this exercise gives an insight into the funding patterns of only seven National Societies, when replicated on a larger scale it could provide valuable information on volume and trends within the Red Cross and Red Crescent Movement. While the global reach of the Movement – based on its worldwide presence and its network of volunteers – is well understood, a more complete funding picture will enable a better assessment of the full financial scale and weight of the Movement within the delivery system, thus emphasising its influence. It could also lead to improved coordination across the Movement, enabling better programmatical decisions and more effective assistance for those in need.


Related content
Priorities for the UK’s incoming Secretary of State Alok Sharma
As Alok Sharma takes office as Secretary of State, DI's Amy Dodd sets out key priorities for the UK and its global development agenda.
From review to delivery on the Global Goals – what should the immediate priorities be for the UK government?
On 26 June, the UK government published its Voluntary National Review measuring delivery against the Global Goals - but does it accurately capture progress?
Three priorities for the High-level Political Forum 2019
DI Director of Partnerships & Engagement Carolyn Culey sets out three key priorities for closing the gap between the poorest and the rest at HLPF 2019